

Tanvi Upadhyay
BLOG / Performance Management, Strategic Planning and Execution
Performance Management Plan: A Complete Guide With Templates and Examples
Written by:
AI + Performance Management, in One Platform
Book A Demo
Performance Review Calibrations Made Easy
Performance review calibration aligns manager ratings, prevents bias, and ensures consistent fairness across your organization.
See Nova in Action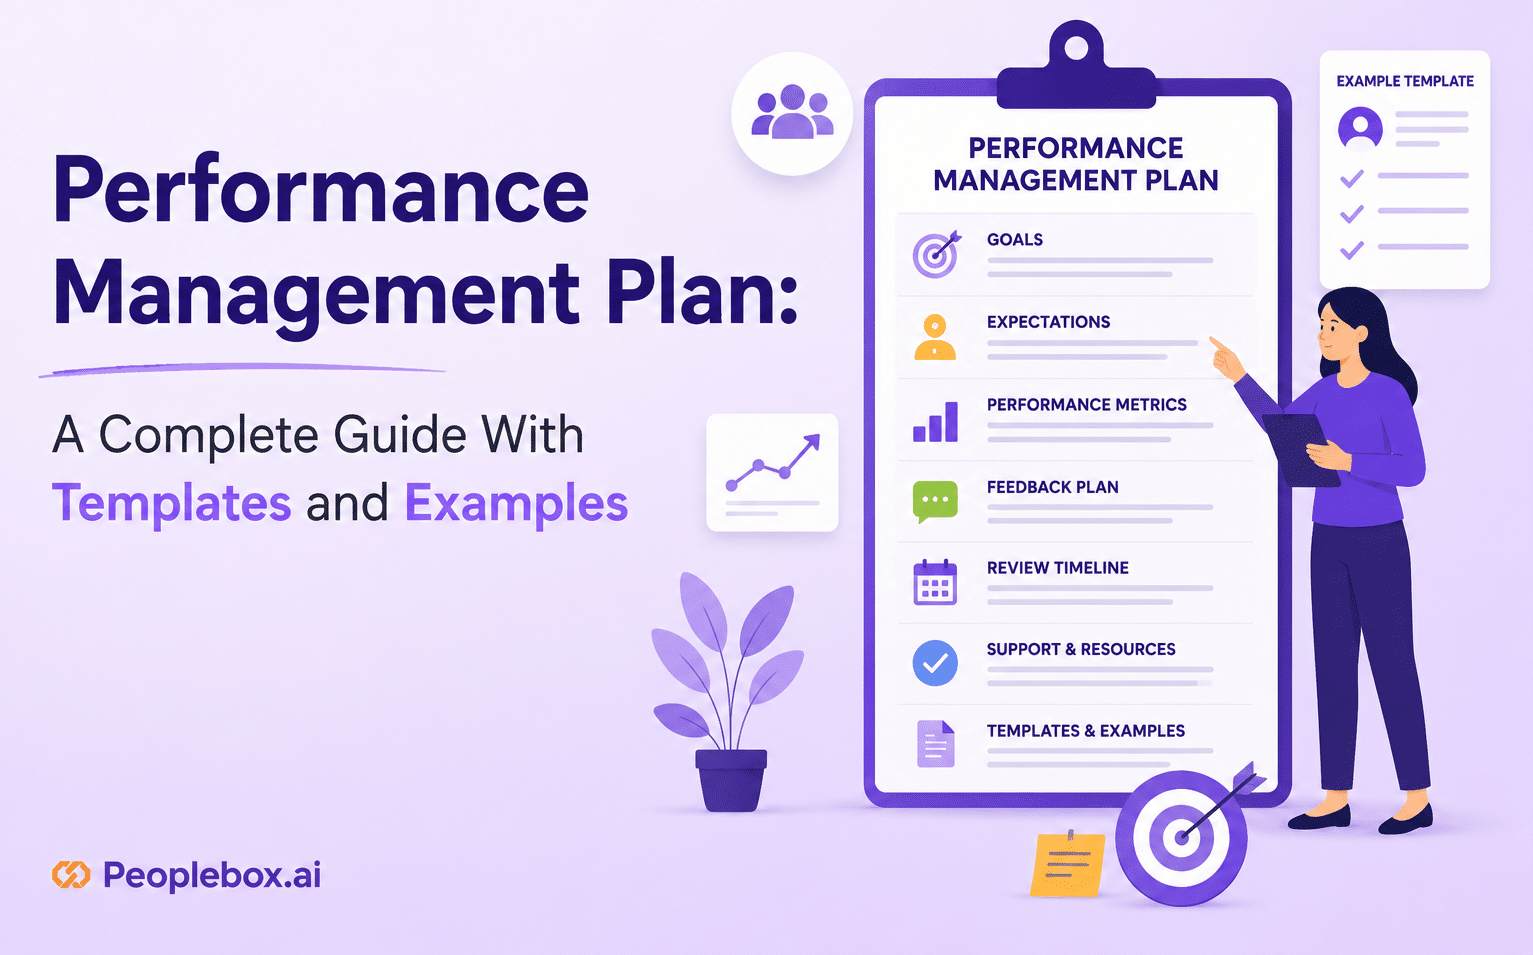
March 5, 2024
TL;DR
Every sector, including HR, is rapidly adopting AI in 2024. As of early 2024, about 38% of HR leaders are actively piloting or have already implemented generative AI technologies within their operations, showing a significant increase from 19% in mid-2023. This is in line with another survey where 61% of CHROs planned to invest in AI in 2024.
A performance management plan is how an organization moves beyond spreadsheets. 58% of companies still track performance in Excel, and for companies with less than 100 employees, it works. Beyond that, the margins widen, ratings become subjective based on a manager’s personal perspective, KPIs can have various meanings across departments, and annual schedules offer no flexibility to adjust mid-year. By the time compensation decisions happen, there is no data supporting these decisions. All this leads to an annual routine without any progress made.
This guide covers what a structured performance management plan includes, how it differs from a performance improvement plan, and how to build one, with six ready-to-use templates for the full cycle. Insights in this guide are drawn from Peoplebox.ai’s demo and implementation call recordings with HR leaders across 200+ companies.
What Is a Performance Management Plan?
A performance management plan is a structured framework that defines how an organization sets goals, evaluates performance, and develops employees across a review cycle. It is not a document about a single employee; rather, it is a system put together by HR for the organization as a whole.
A complete plan includes:
- How company goals break down into individual targets, and who is responsible for each
- How often do performance conversations happen annual, quarterly, or continuously
- Who gives feedback on whom: self, manager, peers, or all three
- The way ratings are standardized using calibration techniques across different managers
- The connection between performance results, compensation, promotions, and individual development
A well-designed performance management plan is what makes performance reviews mean something beyond the review itself. Done right, it produces performance decisions that hold up under scrutiny.
Before going further, a performance management plan is not the same as a performance improvement plan (PIP). They are often confused, but they do different jobs.
Performance Management Plan vs. Performance Improvement Plan
Both documents deal with performance, and the names are often used interchangeably, but they are not the same thing. Here is the difference:
| Criteria | Performance Management Plan (Organizational) | Performance Improvement Plan (PIP) |
|---|---|---|
| Purpose | Strategic framework for managing performance across the whole organization | A formal document used to address an employee’s performance issues |
| Audience | All employees, all departments | One employee at a time |
| Owner | HR + leadership team | Direct manager + HR business partner |
| Time horizon | Annual or multi-year, refreshed each cycle | 30, 60, or 90 days |
| Includes | Goal-setting framework, review cadence, evaluation criteria, calibration, development tracks | Specific performance issues, measurable improvement targets, support resources, and consequences |
| Outcome | Aligned workforce and defensible data for compensation, promotions, and succession | Documented path to improvement, role change, or exit |
A performance management plan that never issues any PIPs, even when required, cannot be considered honest. A company that relies on PIPs without a performance management process is depending on consequences without having a structure. The two types of documents are to be found in the same toolkit, but they do different jobs.
Six Elements Every Performance Management Plan Must Include
A performance management plan is only as operational as its weakest element. Here are the six components that matter and what breaks without each one.
1. Clear, Cascading Goals
Without any connection to company objectives, goal setting creates activity but not alignment. Individual goals should connect with team targets, which connect to department goals, which connect to company objectives. The specific methodology used – OKRs, SMART goals, KPIs is secondary to whether the connection exists at all. For instance, when a 200-person SaaS company rebuilt its plan from scratch, the new Head of HR made goal cascading mandatory from day one. In the previous cycle, managers had set individual goals independently without any connection to what the company was trying to achieve that year.
The consistent failure point is KPI standardization.
Solution: Define terms before the cycle begins. Establish the objectives at the company level and then allow teams for goal creation within those objectives.
2. Defined Review Cadence
Annual-only cycles are the most common pattern we observed, and the most common thing companies change when they rebuild.
The shift from annual to quarterly and even to continuous review does not involve changing frequency, but it is about the lag between behavior and feedback. A review arriving in December cannot change anything that happened in March. Quarterly check-ins do not require full review cycles; they’re about checking progress against the goal.
Most companies transition to a hybrid: quarterly check-ins for goals, annual review for full competency assessment.
3. Multi-Stakeholder Feedback
A performance evaluation based on one person’s view is a personality assessment, not a performance record.
Operational plans include at minimum: self-review, direct manager review, and at least one peer input. More complex configurations add skip-level managers, matrix managers, and direct reports, building toward a full 360-degree feedback cycle. One of our clients, a 5,000-person Indian tech-enabled services firm, runs a four-stage cycle: self-review, manager review, peer review, and calibration with hierarchical rating override, because any single evaluator’s rating reflects their proximity to the work, which varies by role and relationship.
For companies starting fresh, self plus manager plus one peer input is enough for the first cycle. Add layers as the process matures.
4. Calibration and Rating Standardization
This part is generally neglected by most mid-market companies in their first plan, and it is where performance calibration does the most damage when missing.
In its absence, a liberal manager will have bloated ratings for his or her team members. Conversely, a strict manager will give deflated ratings. The employees can see this, especially at compensation time.
Calibration is a meeting where managers compare ratings between teams and standardize them before releasing the ratings to the employees. In large enterprises, this entails following performance management bell curve or nine-box guidelines. For mid-market companies, comparing the distribution within different departments before releasing the ratings provides sufficient benefits.
One of our clients, a 300-person Indian SaaS company, ran bell curve calibration with automatic manager notifications when calibrated scores changed from an original rating. Such a process ensures that there is no surprise for the manager during the manager-employee discussion.
5. Recognition, Rewards, and Consequences
Performance ratings should connect to something. A review process that produces ratings with no connection to compensation, promotion, or development creates distrust over time. Employees learn quickly whether the system is meaningful or ceremonial.
Ratings feed compensation bands. High-performance ratings trigger promotion conversations. Underperformance triggers a structured support process, which may include a PIP. The performance management plan should specify how each connection works before the first cycle runs, not after the first complaint about a compensation decision.
6. Continuous Development Tracks
Individual Development Plans are the most commonly skipped output of a formal review cycle. Most companies produce generic templates or nothing at all.
A development track does two things: it gives high performers a visible reason to stay, and it gives underperformers a structured path rather than a sudden consequence.
One enterprise client, a Saudi Arabia-based government-tech firm, had one specific buying criterion when evaluating performance management platforms: auto-generated IDP suggestions from review data. They had run review cycles for years and never systematically converted the outputs into individual development plans. The disconnect between review outcomes and growth plans was the gap they were trying to close.
How to Build a Performance Management Plan in 5 Steps
Each step produces the inputs for the next. Skipping one degrades everything downstream.
Step 1: Set Organizational Goals
Before the cycle opens, company objectives need to be finalized and documented. These become the top tier of the cascade.
The common failure is timing. Companies start goal-setting after the review cycle has already opened, which means individual goals get set before the company-level direction is clear. Goals set without an organizational anchor are goals set to be completed, not to matter.
The KPI standardization problem surfaces here, too. One of our clients, a 250-person manufacturing company, had employees who did not understand what was being measured in their own performance criteria. The solution was not better software; it was a pre-cycle workshop where HR clarified terminology across departments before the cycle opened.
Step 2: Define Your Review Cadence and Stakeholders
Choose the cadence and people involved.
Cadence: Annual to semi-annual and annual to quarterly cadences, along with ongoing reviews, are the most common transition models among our customers. Quarterly cycles are ideal for the product, sales, and growth teams. Annual cycles are suitable for functions with long project lifecycles.
People involved: Understand your reviewer connections before creating forms. The self-review is the minimum requirement. The manager review is mandatory for everyone. Other than that, the structure will determine your setup. In a matrix organization, you need a dotted-line manager’s review. In a flat organization, you can conduct a peer-dominated 360-degree review.
Step 3: Build Evaluation Criteria – Goals and Competencies
A complete performance evaluation has two dimensions: what someone achieved (goals) and how they achieved it (competencies).
Goals-only evaluations miss behavioral performance entirely. Competency-only evaluations feel subjective and are difficult to calibrate. A weighted combination, commonly 60% goals, 40% competencies, produces a defensible, full-picture evaluation.
Competency frameworks do not need to be complex. Five to seven behavioral competencies, rated on a consistent scale, give managers enough structure to evaluate meaningfully. They should be role-specific at minimum, what “collaboration” means for an individual contributor is different from what it means for a senior manager.
Step 4: Run the Cycle – Feedback, Reviews, and Calibration
During the cycle, Continuous feedback loops occur constantly within the entire cycle; this is the foundation of continuous performance management. Manager-employee check-ins occur that are centered around progress on goals. Feedback from peers will be conducted periodically, rather than just two days before the review window opens.
At the end of the cycle, A Formal review process will take place based on the criteria outlined in Step 3. The calibration process occurs when managers compare ratings among teams and resolve differences.
Step 5: Close the Loop – Recognition, Development, and Action
The review cycle ends when outcomes connect to decisions, not when the last form is submitted.
After calibration, compensation adjustments reflect the performance data. Promotion conversations are open for high-rated employees. IDPs are generated from review outcomes. Underperformers receive structured support documentation; the PIP template below covers this stage.
After the cycle, document what worked and what did not. Which stages had the lowest completion rates? Where did calibration reveal the most rating inconsistency? The answers feed directly into the next plan revision.
Performance Management Plan Templates
A performance management cycle runs through six stages, and most plans break because one or more stages have no structure behind them.
- Goal Setting: cascading company objectives to individual targets
- Check-ins: ongoing progress conversations between manager and employee
- 360 Feedback: structured input from peers, direct reports, and skip-level reviewers
- Performance Reviews: formal end-of-cycle evaluation against goals and competencies
- Calibration: normalizing ratings across managers before results are published
- Development: converting review outcomes into individual growth plans
- Performance Improvement: formal documentation when a specific employee needs a structured path back to standard performance
We have built one template for each stage. Use them independently or as a connected system; each one produces the inputs the next stage needs.
Template 1: Annual Performance Management Plan (Organizational)
Use this to map the full year’s performance management cycle before it opens. One row per stage.
| Cycle Phase | Timing | Owner | Inputs Needed | Output | Tool |
|---|---|---|---|---|---|
| Goal Setting | Jan 1–31 | HR + Managers | Company goals, role competency frameworks | Signed individual goal sheets | Performance management software / Google Sheet |
| Q2 Check-in | Apr 1–15 | Managers | Goal sheets, check-in notes | Progress notes + updated action items | 1:1 tool |
| Q3 Check-in | Jul 1–15 | Managers | Updated goal sheets, check-in notes | Progress notes + flagged risks | 1:1 tool |
| 360 Feedback Collection | Sep 15–30 | HR | Reviewer assignments | Completed peer feedback records | 360 tool |
| End-of-Cycle Review (Q4) | Oct 1–Nov 15 | Managers + Employees | Goal data, feedback records, competency ratings | Draft ratings | Review platform |
| Calibration | Nov 15–30 | HR + Leadership | Draft ratings, distribution data | Calibrated final ratings | Calibration module |
| Recognition + IDPs | Dec 1–15 | HR + Managers | Calibrated ratings | IDP assignments, compensation adjustments, promotion decisions | HRIS + IDP tool |
Template 2: Individual Goal-Setting Template
Use this at the start of each review cycle, one row per goal. The examples below cover five common roles: Sales Representative, Software Engineer, Product Manager, Customer Success Analyst, and Recruiter. Adapt the goals, weights, and success criteria for any role in your organization.
Role: Sales Representative
| Goal | Type | Weight % | Success Criteria |
|---|---|---|---|
| Achieve annual revenue quota | KPI | 40% | Closed revenue ≥ $480K by Dec 31 |
| Build a qualified pipeline | KPI | 30% | 25+ SQLs/month for Q3 and Q4 |
| Improve NPS on owned accounts | KPI | 20% | NPS ≥ 50 across owned accounts |
| Complete sales enablement certification | Learning | 10% | Certification completed by Sep 30 |
Role: Software Engineer
| Goal | Type | Weight % | Success Criteria |
|---|---|---|---|
| Deliver Q3 product features on schedule | KPI | 40% | 3 features shipped by Sep 30 with ≤ 2 critical bugs |
| Reduce system error rate | KPI | 30% | Error rate below 0.5% by Q4 |
| Improve code review turnaround | KPI | 20% | Average review completed within 24 hours |
| Complete cloud architecture certification | Learning | 10% | Certification completed by Dec 31 |
Role: Product Manager
| Goal | Type | Weight % | Success Criteria |
|---|---|---|---|
| Ship Q3 roadmap on schedule | KPI | 40% | All Q3 features launched by Sep 30 with ≤ 3 post-launch critical bugs |
| Improve feature adoption rate | KPI | 25% | Feature activation rate ≥ 60% within 30 days of launch |
| Reduce discovery-to-delivery cycle time | KPI | 25% | Average cycle reduced from 6 weeks to 4 weeks by Q4 |
| Complete product analytics certification | Learning | 10% | Certification completed by Aug 31 |
Role: Customer Success Analyst
| Goal | Type | Weight % | Success Criteria |
|---|---|---|---|
| Maintain portfolio retention rate | KPI | 40% | Net revenue retention ≥ 105% by Dec 31 |
| Drive product adoption across accounts | KPI | 30% | 80% of assigned accounts achieve core feature activation by Q3 |
| Improve account health score accuracy | KPI | 20% | Health score predictions match churn outcomes within 15% variance by Q4 |
| Complete customer success certification | Learning | 10% | Certification completed by Sep 30 |
Role: Recruiter
| Goal | Type | Weight % | Success Criteria |
|---|---|---|---|
| Reduce average time-to-hire | KPI | 40% | Time-to-hire reduced from 45 to 28 days by Q4 |
| Improve the offer acceptance rate | KPI | 30% | Offer acceptance rate ≥ 85% by Q3 |
| Improve candidate quality score | KPI | 20% | Hiring manager satisfaction score ≥ 4.2/5 by Q4 |
| Complete sourcing strategy certification | Learning | 10% | Certification completed by Aug 31 |
Template 3: 360-Degree Review Form
Use for peer, direct report, and skip-level review collection.
| Competency | Rating (1–5) | Evidence / Example |
|---|---|---|
| Communication – clear, timely, and adjusted to the audience | ||
| Collaboration – builds working relationships, shares information | ||
| Accountability – follows through on commitments without prompting | ||
| Problem-Solving – identifies issues, proposes actionable solutions | ||
| Leadership / Influence – guides, coaches, or models behavior for others | ||
| What does this person do consistently well? | ||
| What should this person focus on developing? |
Rating scale:
1 = Rarely demonstrates
2 = Sometimes
3 = Consistently
4 = Often exceeds expectations
5 = Always demonstrates
Anonymous: Yes / No – configure per cycle in HR settings
Template 4: Continuous Feedback / 1:1 Check-In Template
Use weekly or bi-weekly. Carry forward action items between sessions.
| Field | Notes |
|---|---|
| Date | |
| Wins since last check-in | |
| Blockers / what is slowing progress | |
| Goal progress update (one row per active goal) | |
| Manager feedback | |
| Employee questions or concerns | |
| Action items | Owner + due date |
| Items to carry forward to next check-in |
Template 5: Individual Development Plan (IDP)
Use within two weeks of the formal review cycle closing.
| Field | Notes |
|---|---|
| Employee name | |
| Review period | |
| Career goal (1–3 year horizon) | |
| Current strengths (from review data) | |
| Development areas (from review + 360 feedback) | |
| Development Action 1 | Learning activity + timeline + success measure |
| Development Action 2 | Learning activity + timeline + success measure |
| Development Action 3 | Learning activity + timeline + success measure |
| Manager support needed | |
| Checkpoint date | |
| Progress notes at checkpoint |
Template 6: Performance Improvement Plan (PIP) – 30/60/90 Format
Use when formal performance documentation is required for an individual employee.
| Field | Content |
|---|---|
| Employee name | [Name] |
| Role | [Title, Department] |
| Manager | [Name] |
| HR partner | [Name] |
| PIP start date | [Date] |
| Performance issue | Describe the specific, documented gap with examples and dates. |
| Expected standard | Define exactly what “meeting expectations” looks like in measurable terms. |
| 30-day milestone | Specific, measurable outcome expected by day 30 |
| 60-day milestone | Specific, measurable outcome expected by day 60 |
| 90-day milestone | Specific, measurable outcome expected by day 90 |
| Support and resources | Training, coaching, additional manager time, or tools provided |
| Check-in schedule | Weekly/ bi-weekly / milestone-based |
| Consequence of milestones not met | State clearly: role change, reassignment, or separation |
| Employee signature | [Date] |
| Manager signature | [Date] |
Case Study: A Performance Management Plan Rebuild
A Saas company with 200 employees followed the same annual review process for three years: setting performance goals by individual managers at the start of January, sending out an evaluation form via email in December, compiling the ratings using Excel, and making compensation decisions in January based on their recollection.
The expected outcome? Ratings were inconsistent across managers, compensation decisions lacked consistency, and top performers were quitting when the time came for their reviews.
Three years later, the same outcome kept coming back, prompting the HR department to revamp its process. They launched their new process while simultaneously continuing with the old annual review process for three months.
What changed in year one:
- Goals cascaded from company objectives for the first time, and managers set department targets before sitting down with their teams
- Quarterly check-ins replaced the once-a-year conversation: 30 minutes, shared template, no formal rating
- Peer feedback collected two weeks before the review window, three reviewers per employee, five competencies, plus open text
- Calibration was introduced for the first time: managers reviewed distribution data as a group before results were published. In the first session, one department had rated 80% of employees in the top two tiers, a pattern the manager acknowledged reflected relationships, not performance
- IDPs are issued within two weeks of the cycle closing for all high-rated employees
After two cycles:
Rating variance across managers dropped, and compensation decisions became documented and defensible. Exit interview data from the following year pointed to one consistent theme: performance decisions felt fairer than before.
Not dramatic but operational. The plan removed the arbitrariness, and that was enough.
How to Know If Your Performance Management Plan Is Working
An annual process that is not evaluated becomes a mere ritual. Watch out for these four signs after each cycle:
- Rating distribution variance across managers: After calibration, check whether any improvements in the distribution in comparison with the last cycle. A good performance management plan works towards bridging the difference between the most generous and tightest managers.
- Review completion rates: Track whether managers finish cycles on time. Low completion rates indicate tool friction or manager disengagement, both are plan problems, not people problems.
- IDP completion at six months: There will be tangible evidence of progress achieved with the development plan at the six-month stage. If not, then the development component in the plan will only serve as formality.
- Attrition correlation with review outcomes: Track whether high-rated employees are staying and low-rated employees are either improving or exiting. A plan that does not influence retention is functioning as paperwork, not as a management system.
These are the indicators to evaluate after every cycle. They need to be analyzed for improvements in the next cycle’s plan.
| See what a working performance management plan looks like in software
If your ratings still vary by manager, your IDPs aren’t being followed through, or calibration isn’t happening, Peoplebox.ai built performance management software to fix exactly that. Goal cascading, bell-curve calibration, structured 1:1s, and IDP generation from review data, connected in one system. |
Conclusion
The biggest reason most companies fail when they redesign their performance management system is not that they chose the wrong approach. Their failure lies in the fact that the new design exists in a PowerPoint slide and the execution exists in an Excel spreadsheet – the same one that they had been using all along.
Templates provided in this guide provide you with the design. What will make your system different is the effort you put into reaching an agreement about KPI definitions, executing a calibration process, and developing follow-up routines.
FAQs
What does a performance management plan include?
A complete performance management plan includes six elements: cascading goal-setting from company objectives to individual key results, a defined review cadence, multi-stakeholder feedback configuration (self, manager, peers), calibration to normalize ratings across managers, a recognition and consequences framework tied to ratings, and individual development plans produced after each cycle closes.
What are the 5 C's of performance management?
The 5 C’s are Clarity (goals and expectations defined upfront before the cycle opens), Commitment (manager and employee aligned and accountable to the plan), Communication (ongoing feedback throughout the cycle, not just at review time), Coaching (structured conversations that develop performance rather than only evaluate it), and Connection (linking individual performance to broader company objectives so goals mean something beyond the immediate role).
How is a performance management plan different from a PIP?
A performance management plan is an organizational framework that applies to all employees. A performance improvement plan is a formal document created for one specific employee to address documented underperformance. The performance management plan is the system. The PIP is a tool that the system produces when needed. The comparison table earlier in this guide covers the full distinction.
Why would someone be put on a PIP?
A PIP is typically initiated when an employee has documented, measurable underperformance against agreed-upon targets, has received feedback and support through the regular performance cycle without meaningful improvement, and continues to miss the expected standard after informal coaching. Repeated behavioral concerns can also trigger a PIP depending on HR policy. A well-constructed PIP documents a specific, addressable gap; it should not serve as paperwork for a decision that has already been made.
How serious is being put on a PIP?
It is serious because it creates a formal, signed performance record. Most HR policies require communicating that directly to the employee. At the same time, most PIPs are designed to give the employee a real path back to standard performance, defined milestones, identified support resources, and a manager who is accountable for the coaching, not just the evaluation. Whether a PIP results in improvement or separation depends on whether the performance gap is genuinely addressable and whether both parties engage honestly with the process.
How long does it take to roll out a new performance management plan?
Tool implementation for a digital performance management platform typically runs 1–6 weeks. Full plan rollout, goal cascading, stakeholder configuration, review templates, calibration guidelines, usually takes 6–12 weeks and is best timed 2–3 months ahead of the next annual appraisal cycle. In our customer data, one Mauritius-based agribusiness completed full implementation in 15 working days; one Indian fintech company completed onboarding in 1–1.5 weeks. The timeline depends on the number of employee populations and review cycle configurations being set up.
Do I need software to run a performance management plan?
No. An Excel-based plan works at a small scale, and many companies operate that way. up to 100–150 employees. The consistent pattern in our data is that the manual approach breaks somewhere between 100 and 250 employees, when calibration becomes necessary, when goal-setting needs to happen across multiple teams simultaneously, and when review forms need to support different structures for different departments. At that point, the manual overhead outweighs the cost of a purpose-built tool. If you are still in the earlier stage, the templates in this guide can carry you further than most people expect.
TABLE OF CONTENTS
RELEVANT ARTICLES
Our Customers Love us